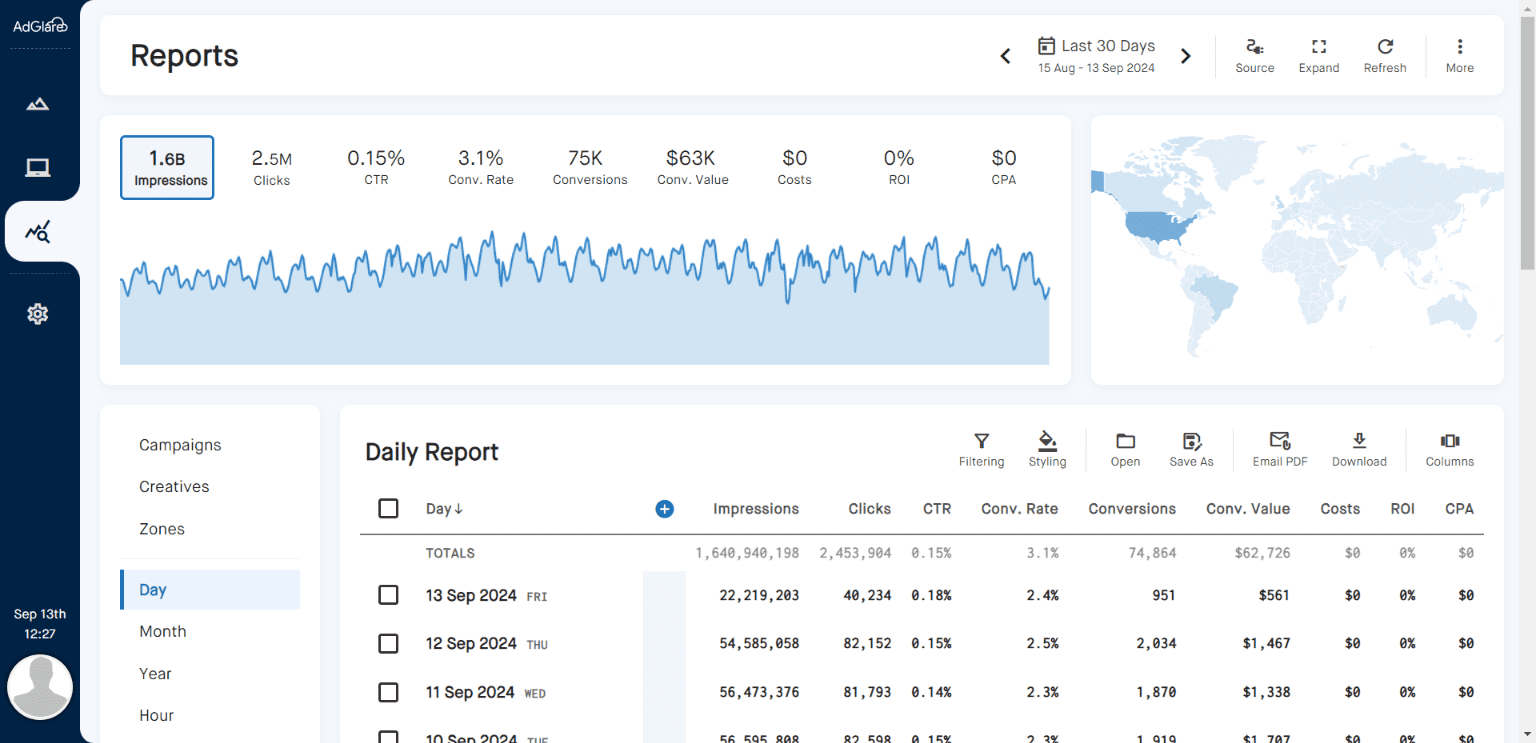
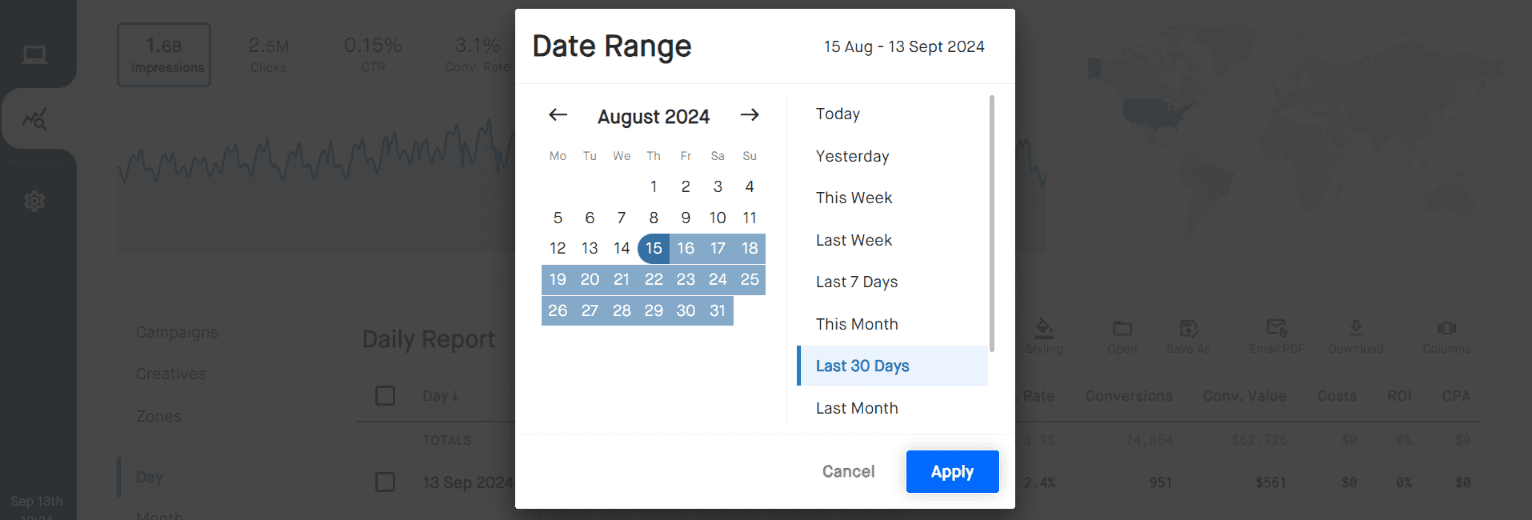
Creating ReportsTable of Contents1. Overview 2. Data collection 3. Generating reports 4. Dimensions 5. Events & Metrics 6. Comparing periods 7. Downloading a report 8. Emailing a report 9. Conditional styling 10. Currency & timezone OverviewThis section provides detailed insights into the performance and effectiveness of your ad campaigns, offering valuable data to inform your strategy and optimize results. Here, you'll learn how to generate, interpret, and customize reports to track key metrics such as impressions, clicks, conversions, and more.Data collectionEvent data is collected every minute with a 3-minute delay. If you expect to see analytical data after loading an ad on a page, make sure to wait up to 3 minutes.Generating reportsAt the top of the Reports section, you can select the desired date range to filter the data according to your needs. This is also the place where you can indicate which campaigns or zones should be used to generate the report using the 'Source' button. There's a list of presets like 'Last 30 Days' or 'This Month' to make range selection easier.DimensionsWhen generating a report, dimensions are the categories you can use to break down and analyze your data. AdGlare collects the following dimensions when serving ads:
Events & MetricsEvents and metrics are related. From a technical point of view, an event is a counter that continuously increments. A metric is a formula that applies some calculus to event data.EventsAdGlare has the following event counters:
MetricsBy default, the following commonly used metrics are available using event data:
Comparing periodsWhen viewing the Reports page, comparing performance across the previous time period can provide valuable insights into how your campaigns are progressing. This feature allows you to track trends, measure improvements, or spot declines in key metrics like impressions, clicks, conversions, and CTR.To compare metrics with the previous period, navigate click the 'More' icon at the top right, then choose 'Settings'. Enable the toggle for 'Compare Previous Period'. Downloading a reportReport data can be downloaded by clicking the 'Download' icon at the top right. The following formats are supported:
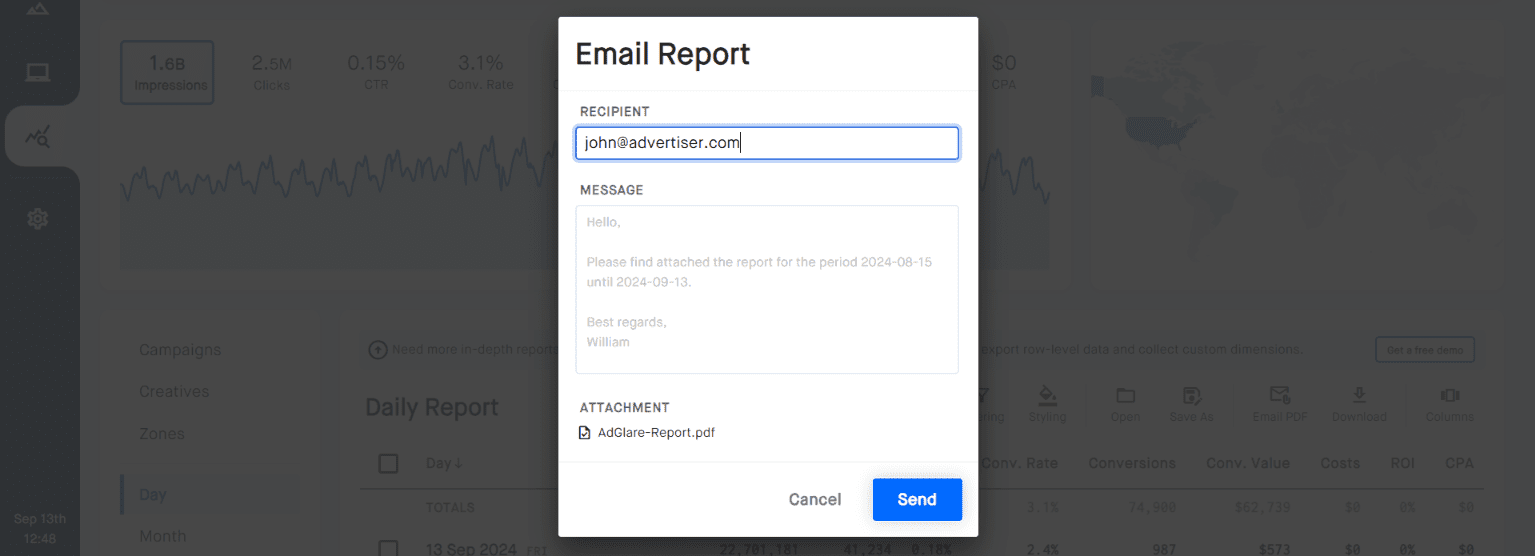
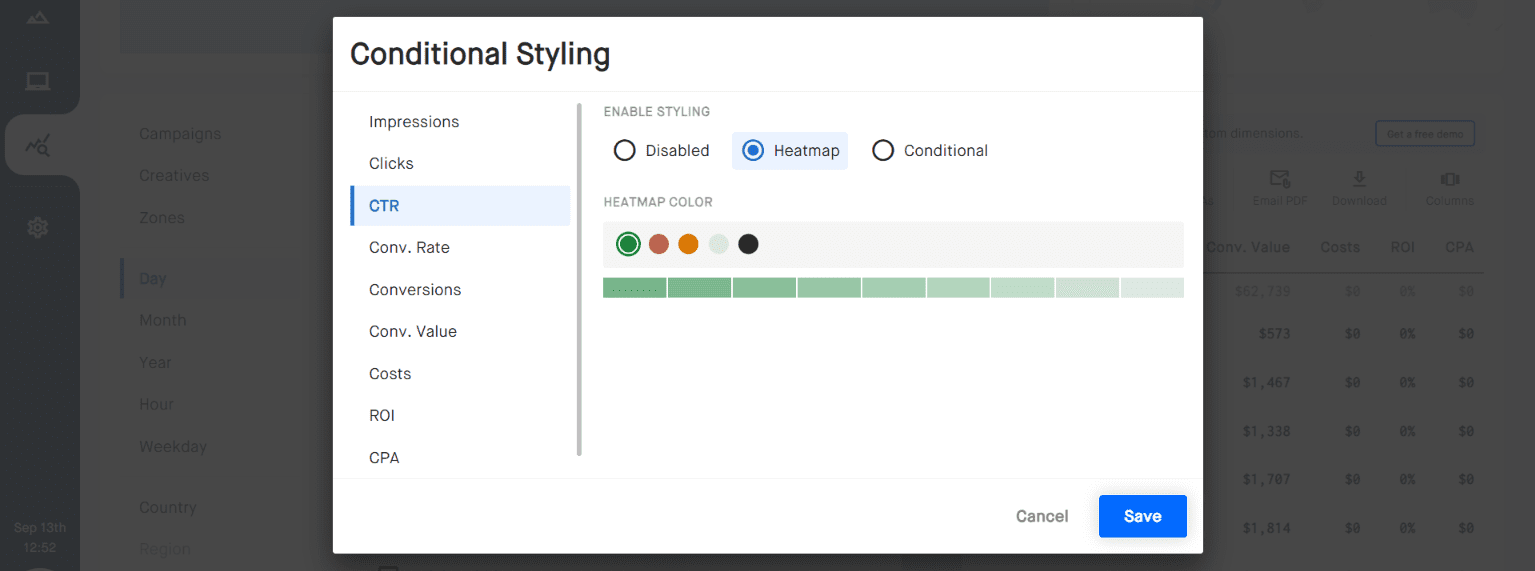
Emailing a reportInstead of downloading a report, you can generate a PDF version and have it sent directly to your email address or that of your advertiser. This feature simplifies sharing and ensures that the report reaches the intended recipient promptly. By using this option, you can automate the distribution process and keep all stakeholders informed with minimal effort.Simply click the 'Email PDF' icon at the top right. Conditional stylingConditional styling is a powerful feature used to format reports based on specific thresholds or rules. It allows you to apply different colors to elements based on their values. For instance, you can highlight high-performing metrics in green and low-performing ones in red, making it easier to quickly identify key insights and trends.Click the 'Styling' icon at the top right to open the formatter. Imagine you want to determine on which days the CTR was the highest, while keeping the table sorted by day. In this case, the days with the highest CTRs will be colored in darker green:Currency & timezoneTo change the currency, navigate to Settings => User Interface. From there, you can set the currency and time zone used for reporting. Please note that:
Reach out to emailAdGlare Support in case you need further help. You can expect a reply in less than 24 hours. |
More guides
The Basics
Getting StartedUnderstanding the UI
Serving Ads
CampaignsCreatives
Zones
Ad Tags
Reports
Creating ReportsCustom Dimensions
Data Shipping
Viewability
Settings
Ad SizesBot Filter
White Label
Advanced
Native AdsMacros
Tracking Pixels
Custom Metrics
Creative Optimization
Lazy Loading
Frequency Capping
Management
Team MembersOthers
TroubleshootingBest Practices
Terms & Definitions
AdGlare Subscription


